Download: Tech Demo (2006-04-18) for Linux, Win32 and MacOSX Download: Video Preview
Thanks to a hint on netznetz.net about the wonderful processing, I was able to stitch together a first working draft of Rhizome Navigation with a three-dimensional graph.
It is not working yet as an applet embedded in the site, because unfortunately it seems not too easy to create an applet using openGL. I’m working on that. …it works now! and there are still downloads for Linux, Win32 and MacOSX with a test application.
Legend
In 2003, when reading Deleuze’ and Guattari’s Mille Plateaux while staying in Greece for three months (and drinking Vodka at 10am when a good friend told me that Johnny Cash died) I came up with the idea of Rhizome Navigation. I did the following draft back then.

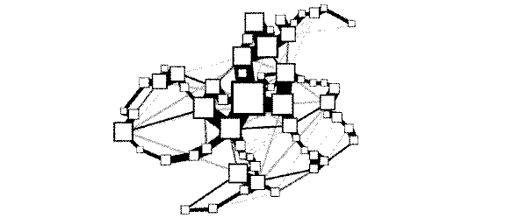
My intention was to visualize data through analyzation of user behaviour. Finally, the example application (the image at the beginning is an actual screenshot from the application) does exactly that. It renders the relations between single Pages from this Wiki by analyzing how links were used and how long visitors stayed on a page. A page is represented by a box and the corresponding title, a link is displayed by a line between two page-boxes. If a link was used more often, the line gets shorter and thicker, bringing the two page-boxes closer together.
In the test program you can use the mouse and shortcuts to navigate through the graph. This is far from perfect of course. I think most essential in improving the way we read and use this kind of three-dimensional graph are the available tools to navigate it. So, it’s nice that I made it this far, but it is just the beginning.
References / thanks to
- processing - initiated by Ben Fry and Casey Reas
- OCD Library - by Kristian Linn Damkjer
- Physics Library - by Jeffrey Traer Bernstein
- Billboard Class - by cchoge
Feedback and Support
If you have questions or feedback regarding Rhizome Navigation please head over to the discussion boards at berlios.de or contact me directly.